


The World of CO₂
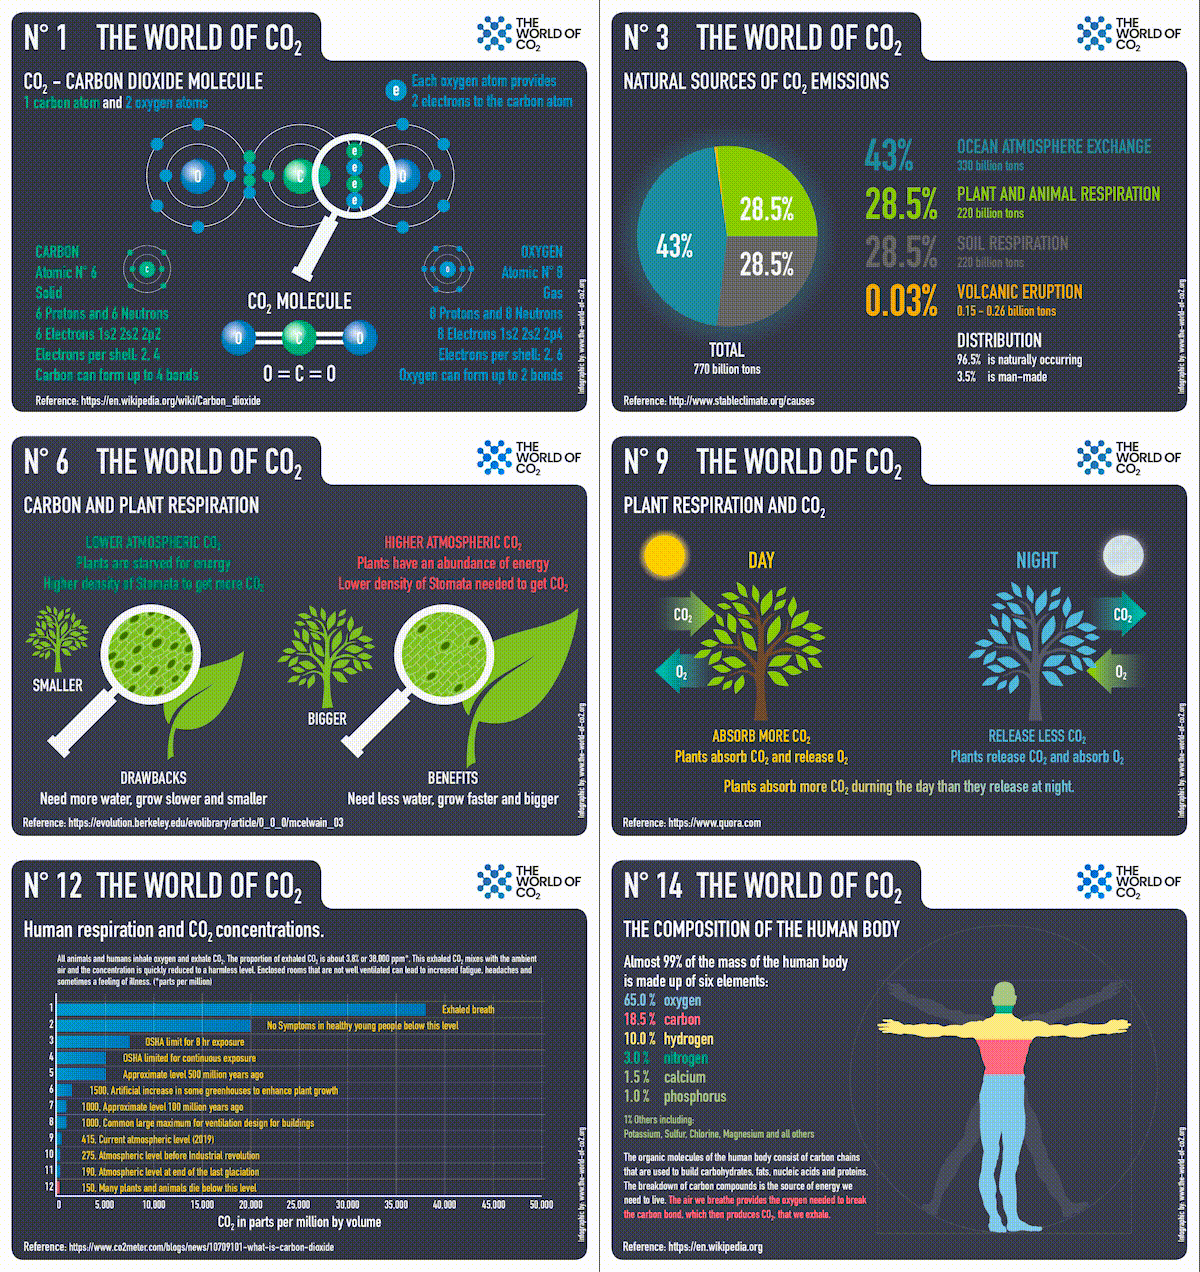
It all starts with the CO₂ molecule, which consists of one carbon and two oxygen atoms.
Chart List*
– N° 1 CO₂ - Carbon dioxide molecule
– N° 2 Earth's atmospheric composition
– N° 3 Natural sources of CO₂ emissions
– N° 4 Global anthropogenic CO₂ emissions
– N° 5 The global carbon cycle
– N° 6 Carbon and plant respiration
– N° 7 Plant categories and abundance (C3, C4 & CAM Plants)
– N° 8 Photosynthesis, the C3 vs C4 gap
– N° 9 Plant respiration and CO₂
– N° 10 The logarithmic temperature rise of higher CO₂ levels.
– N° 11 Earth's atmospheric composition in relationship to CO₂
– N° 12 Human respiration and CO2 concentrations
– N° 13 600 million years of temperature change and atmospheric CO₂
– N° 14 The composition of the human body
*Each chart is linked with a download PDF
All 14 charts in one PDF
About The Audio Guides
Each audio guide is designed to accompany its chart and provide a clear, easy-to-understand explanation of the information shown. Together, the charts and audio tracks create a guided learning experience that explores the science of carbon dioxide, plants, and the natural carbon cycle. All the audio guides can be downloaded.
Downloads à la carte
- 📂 PDF zip file download all charts
- 📂 JPG zip file download all charts
- 📂 PNG zip file download all charts


